Track popularity prediction
Introduction
The aim of track popularity prediction or Hit Song Science is to apply machine learning techniques in order to capture some information from musical data that would explain the popularity of the respective musical tracks.
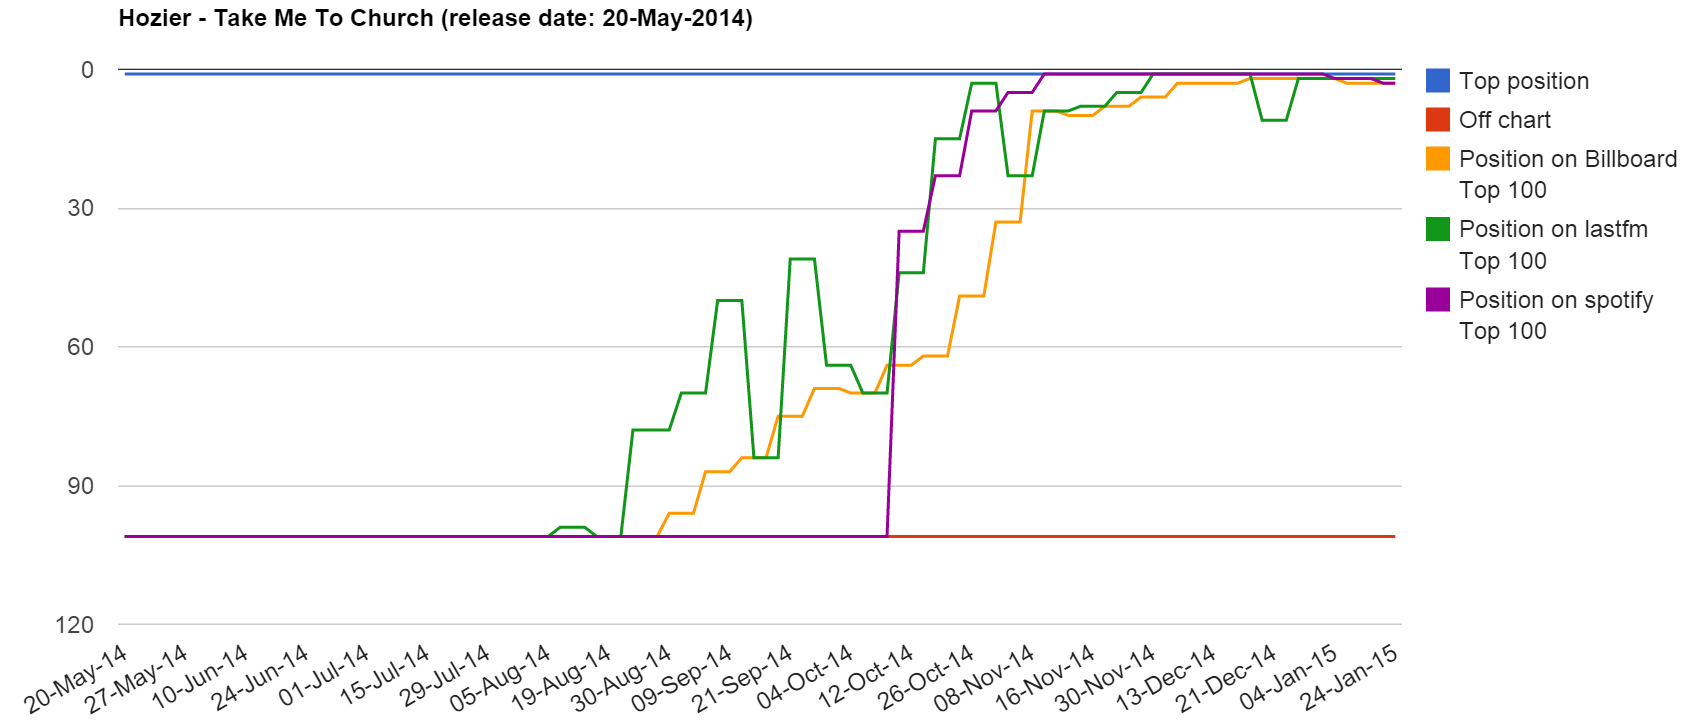
Billboard, last.fm and spotify have explicit rankings of tracks' popularity per week and in cases per day, while the charts are usually location dependent.
Collecting data from the aforementioned sources used to be much easier as Billboard used to offer API access that was decomissioned sometime in May 2013. Last.fm similarly does not currently provide an API for access to the top charts while spotify does provide an API.
Popularity data concerning audio tracks may be used to infer an number of interesting information in the context of music information research, such as:
- Predict track popularity based on track's similarity to tracks that knowledge of their popularity is existing
- Predict track popularity based on Initial/recent popularity and information of what is being played now
- Model popularity towards the identification of a popularity pattern
- Identify differences between hits and non hits
- Intra album popularity prediction
Research in this direction, although has not received much attention, does exist (not complete list, compiled on May 2015):
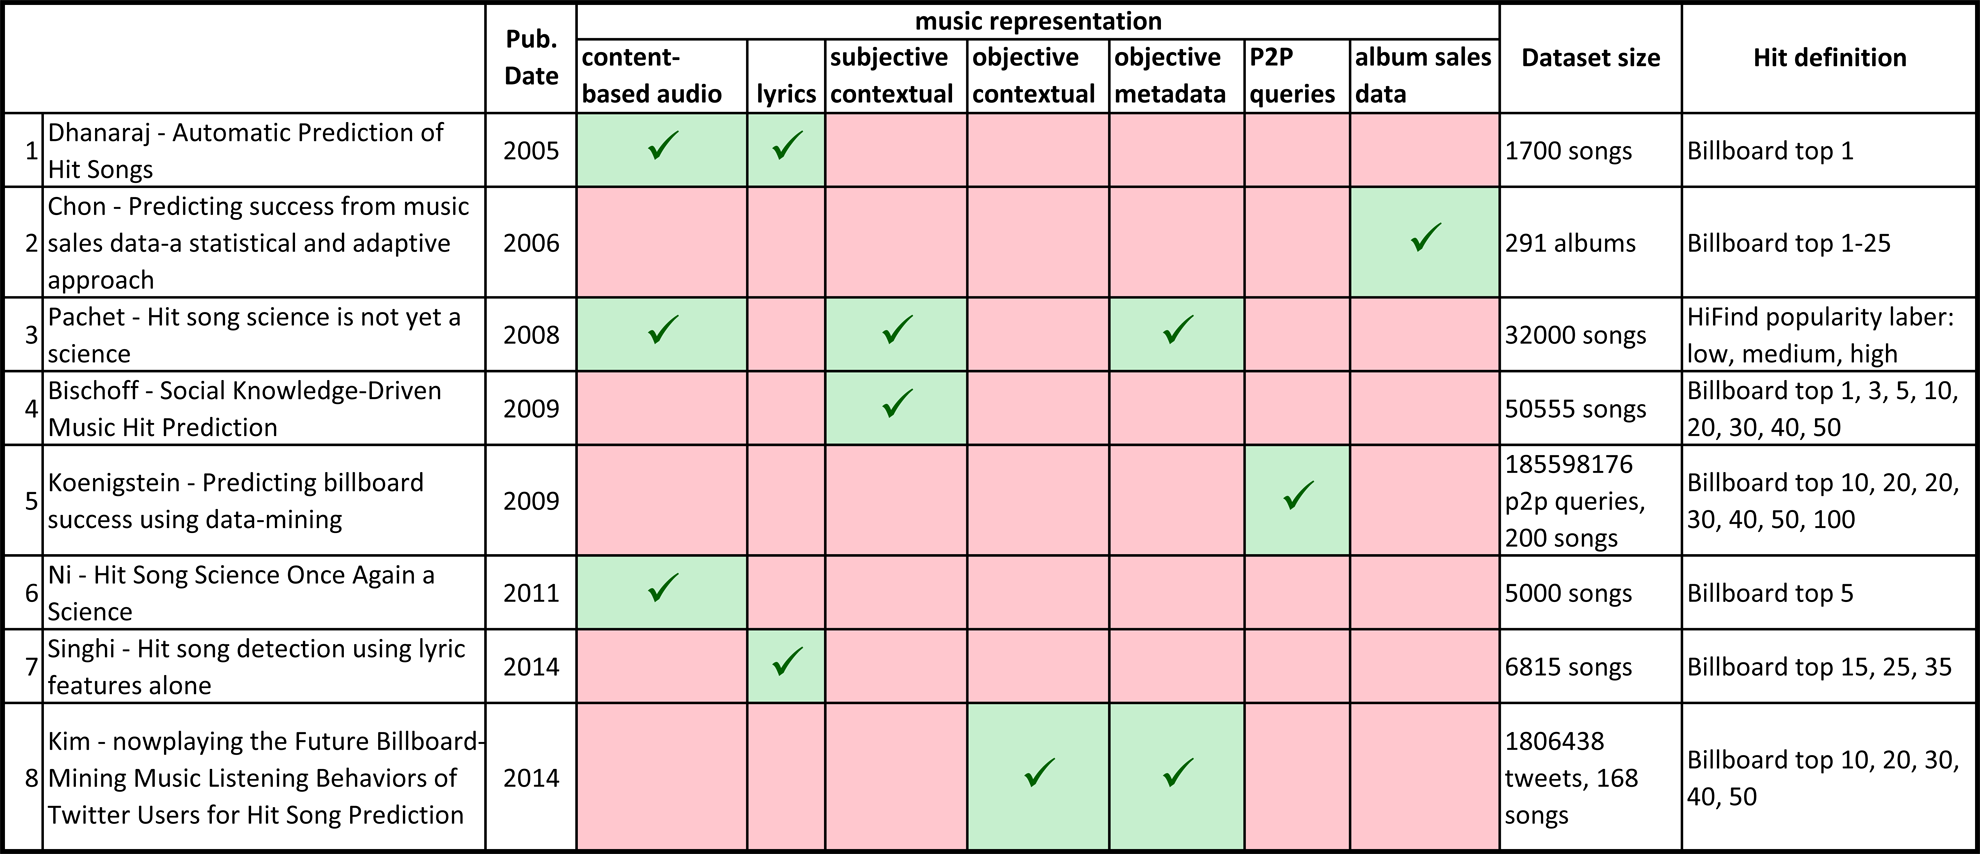
- Dhanaraj & Logan - Automatic Prediction of Hit Songs, 2005
- Chon et al. - Predicting success from music sales data-a statistical and adaptive approach, 2006
- Pachet & Roy - Hit song science is not yet a science, 2008
- Bischoff at al. - Social Knowledge-Driven Music Hit Prediction, 2009
- Koenigstein et al. - Predicting billboard success using data-mining in P2P Networks, 2009
- Ni et al. - Hit Song Science Once Again a Science, 2011
- Singhi & Brown - Hit song detection using lyric features alone, 2014
- Kim et al. - nowplaying the Future Billboard-Mining Music Listening Behaviors of Twitter Users for Hit Song Prediction, 2014
In case intrested, here is tabular preview of the contents of the aforementioned research
Track Popularity Dataset
Music Information Research requires access to real musical content in order to test efficiency and effectiveness of its methods as well as to compare developed methodologies on common data. Existing datasets do not address the research direction of musical track popularity that has recently received considerate attention. Existing sources of musical popularity do not provide easily manageable data and no standardised dataset exists. Accordingly, herein we present the Track Popularity Dataset (TPD) that provides different sources of popularity definition ranging from 2004 to 2014, a mapping between different track/ author/ album identification spaces that allows use of all different sources, information on the remaining, non popular, tracks of an album with a popular track, contextual similarity between tracks and ready for MIR use extracted features for both popular and non-popular audio tracks.
The TPD contains 23.385 tracks of which, 9.193 are designated as popular by appearing in any of the popularity sources charts, while 14.192 are tracks that appear in one of the 1.843 albums of the popular tracks and are not designated as popular by any of the popularity sources. The popularity ratings records, contain the position of a track for a specific week, collected from Billboard are 57.800, while for Last.fm and spotify are 43.300 and 6.500, respectively. Of the popular tracks, 1,5% are designated in all three sources of popularity, 5,9% in two sources and 92,6% in just one source. The discrepancy in proportions is due to the range of available data by the popularity sources. As far as the contextual similarity based on Last.fm's API track.getSimilar method is concerned, 78% of the popular tracks of the dataset have a degree of contextual similarity to other popular tracks of the dataset. As not all tracks' audio files were possible to be found, the TPD contains audio derived features for ~74% of the tracks.
Of the three feature-sets included in the TPD, feature-set A is meant as a small, less detailed feature set for fast and simple research applications. The features included in feature-set A are: overall standard deviation & overall average of spectral centroid (dimension: 1), spectral rolloff point (dim: 1), spectral flux (dim: 1), compactness (dim: 1), spectral variability (dim: 1), root mean square (dim: 1), fraction of low energy windows (dim: 1), zero crossings (dim: 1), strongest beat (dim: 1), beat sum (dim: 1), strength of strongest beat (dim: 1), strongest frequency via zero crossings (dim: 1), strongest frequency via spectral centroid (dim: 1), strongest frequency via fft maximum (dim: 1), MFCCs (dim: 13), LPCs(dim: 10), method of moments (dim: 5), partial based spectral centroid (dim: 1), partial based spectral flux (dim: 1), peak based spectral smoothness (dim: 1), relative difference function (dim: 1), area method of moments (dim: 10). The second feature-set, feature-set B, contains windowed MFCCs (dim: 13), rolloff (dim: 1), brightness (dim: 1), flux (dim: 1), zero crossings (dim: 1), inharmonicity (dim: 1), centroid (dim: 1), spread (dim: 1), skewness (dim: 1), kurtosis (dim: 1), flatness (dim: 1), entropy (dim: 1). The third feature-set, feature-set C, contains 276 target tempi. For each target tempo this feature-set contains eight energy bands and one chroma (dim: 9).
The dataset is divided into two separate parts: part a includes the relations/metadata of the tracks and their popularity while part b contains the files of the three feature-sets.
The first part is in the form of a relational database, the compact schema of which is shown in the following figure.
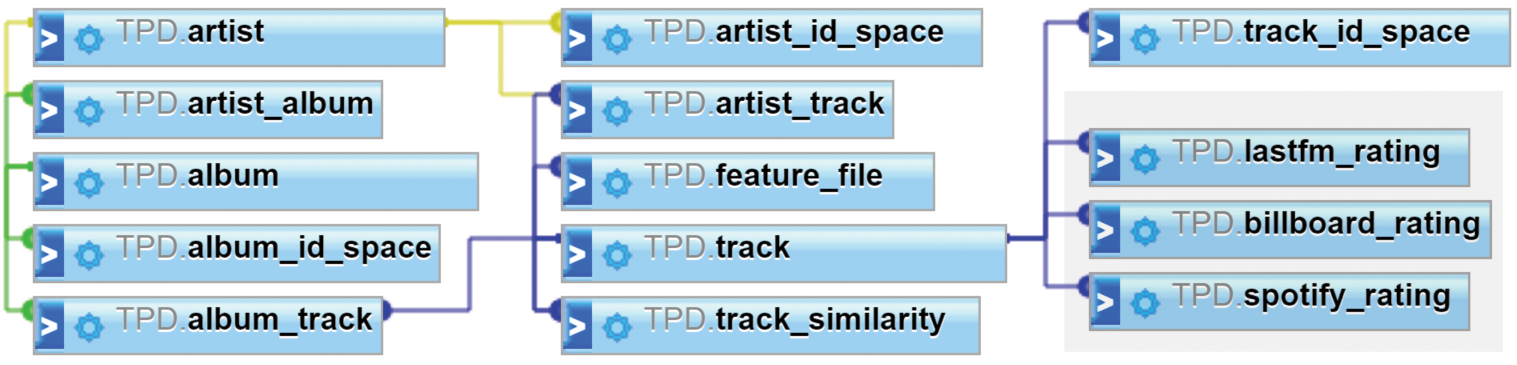
The archive of part a contains the SQL statements that will create the TPD database & tables and subsequently load all the information into the tables of an existing MySQL installation. Moreover, the contents of the first part are also provided in CSV format, in order to support fast use of the data and alleviate the necessity for a relational database. The second part consists of compressed archives of 7z type that contain the feature-sets in a one file with features per track manner. All 7z compressed files with can be decompressed using http://www.7-zip.org/
Showcase & demos
1. Get track's popularity
2. Get artist's top 10 popular tracks
3. Get artist's time on top chart
4. Get a week's tracks on top chart
